Most ad-spy platforms put everything behind a login. WinningHunter does not: six of its utilities sit on the open web, free, with no account and no email required. This review is only about those — what the WinningHunter free tools actually compute, whether their arithmetic holds up, and where they stop.
WinningHunter itself is a paid ad intelligence platform for ecommerce that sits behind the WinningHunter free tools: a searchable library of ads from Meta, TikTok and Pinterest, a database it puts at over two million stores, brand tracking and AI search. We reviewed the paid product separately in our WinningHunter platform review. Here the question is narrower and more practical: how much use you can get out of it before paying anything. The free tools are listed on the site.
WinningHunter publishes six calculators and detectors outside its paywall (brand image from winninghunter.com).
How this review was done
A desk review with one difference: the WinningHunter free tools are public, so they could be run rather than described. No account was created, no email was given, no plan was bought, and nothing was tested inside the paid product. Every calculator example on the site was recomputed by hand, and the two detectors were pointed at a real Shopify store — kittyspout.com, picked because it is a straightforward independent shop with nothing to do with WinningHunter. Where a page states a benchmark figure, it is reported as the company’s figure, because none of them come with a source.
The six WinningHunter free tools and what each one gives you
The WinningHunter free tools split neatly into three calculators and three lookup tools. All of them load instantly, and the badges on each page promise the same thing: free forever, no signup.
Tool
What you put in
What you get back
Profit Margin Calculator
Selling price and cost
Gross margin, net margin, markup, plus a reverse price calculator
ROAS Break Even Calculator
Selling price, COGS, optional ad spend and revenue
Break even ROAS, gross margin, current ROAS, net P&L, units to break even
Instagram Ad Cost Calculator
Budget, CPM, CTR, conversion rate, AOV
Impressions, clicks, CPC, purchases, cost per purchase, break even ROAS
Shopify Theme Detector
Any Shopify store URL
Theme name, developer, price, Theme Store link, page builder
Shopify Apps Detector
Any Shopify store URL
Every detectable app, grouped by category, plus domains touched
Ad reverse search and ad library
An image or a keyword
Matching live ads from the public library
The six WinningHunter free tools, as the site describes them.
That is a wider set of WinningHunter free tools than most competitors offer, and the three calculators are the part worth keeping bookmarked, because they encode the arithmetic that ecommerce beginners get wrong most often.
The profit margin calculator and the markup trap
The margin tool among the WinningHunter free tools does the obvious job, but the explainer under it earns its place. It separates two numbers people routinely confuse: margin is profit as a percentage of revenue, markup is profit as a percentage of cost. Sell at 100 dollars with a 40-dollar cost and your gross margin is 60 percent; the same 60 dollars of profit on a 40-dollar cost is a 150 percent markup.
The line that justifies the whole page is this one: a product with a “50 percent markup” has a 33 percent margin, not 50. Check it — 50 dollars of profit on a 100-dollar cost gives a 150-dollar price, and 50 divided by 150 is 33.3 percent. That single confusion is enough to price a catalogue into a loss, and it is the kind of thing the WinningHunter free tools are genuinely good at heading off. That explainer alone makes the WinningHunter free tools worth a bookmark for a first-time seller.
The ROAS break even calculator
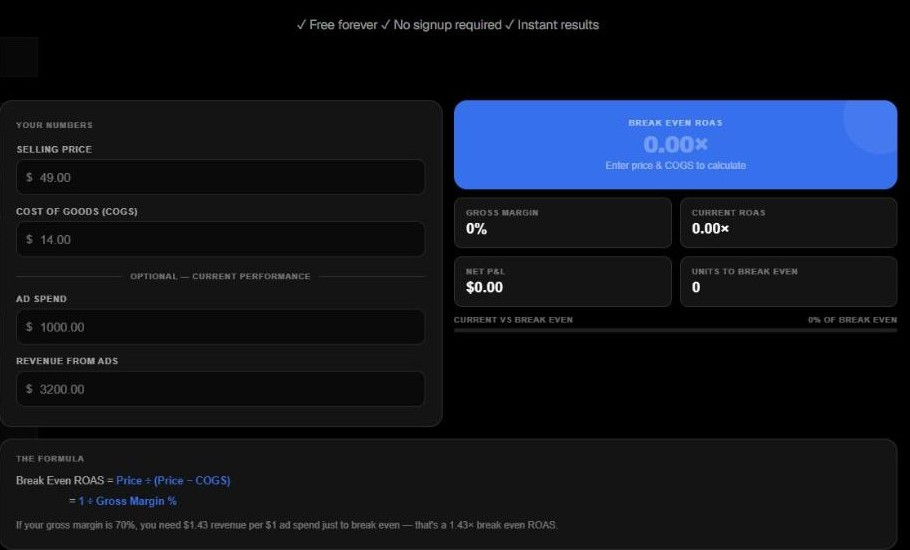
This is the most useful calculator in the WinningHunter free tools, because break even ROAS is the number that decides whether a campaign is working, and almost nobody computes it before launching.
The ROAS calculator, with the formula printed underneath it (screenshot from winninghunter.com).
The formula the page prints is the correct one: break even ROAS equals price divided by price minus COGS, which is the same as one divided by gross margin. The worked example sells at 80 dollars with a 24-dollar cost, calls that a 70 percent gross margin and lands on 1.43 times. Both halves check out: 56 divided by 80 is exactly 70 percent, and 1 divided by 0.70 is 1.4286. The page then translates it into money — every 1,000 dollars of spend needs 1,430 dollars back just to cover product cost — which is also right.
The advice attached to this part of the WinningHunter free tools is sober rather than promotional:
Break even ROAS is your floor, not your goal. Most experienced media buyers aim for 2–4x their break even ROAS as a target. — WinningHunter, ROAS Break Even Calculator
One small presentation quirk: the input boxes show greyed figures (49.00, 14.00, 1000.00, 3200.00) that look like a filled-in example but are placeholders, so the result panel sits at 0.00x until you actually type. And the page carries the heading “What Should Your Target ROAS Be?” twice, once as a line inside the formula block and once as the real section heading below it. Neither affects the maths.
The Instagram calculator in the WinningHunter free tools
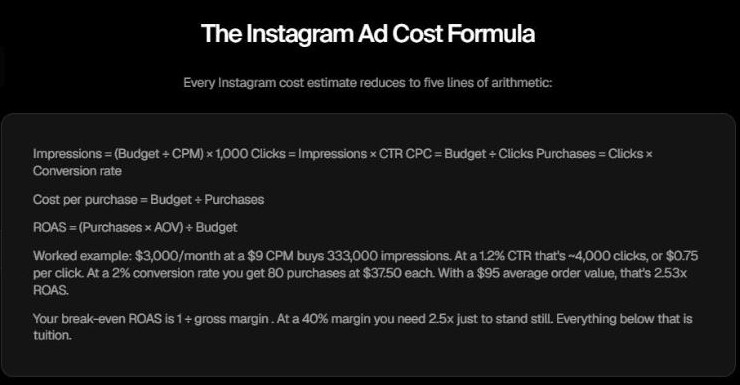
The third calculator in the WinningHunter free tools is the most ambitious, and the only one that publishes its entire model on the page: five lines of arithmetic, no black box.
Five formulas and a worked example, printed in full (screenshot from winninghunter.com).
Step
Formula
Impressions
(Budget / CPM) x 1,000
Clicks
Impressions x CTR
CPC
Budget / Clicks
Purchases
Clicks x Conversion rate
Cost per purchase
Budget / Purchases
ROAS
(Purchases x AOV) / Budget
The model behind the Instagram calculator, exactly as the page states it.
The defaults in the WinningHunter free tools are worth knowing before you trust the output. The page suggests leaving CPM at 8.16 dollars if you do not know your own, notes that Meta’s own minimum daily budget is 5 dollars, and calls a 1 percent click-through rate “the honest baseline”. Those are reasonable starting points, though the 8.16 default sits at the very bottom of the feed CPM band the same page publishes further down.
Checking the maths behind the WinningHunter free tools
Every worked example across the WinningHunter free tools was recomputed by hand. All of them are correct, which is not something you can assume with free marketing calculators.
Claim on the page
Recomputed
Verdict
“50 percent markup” equals a 33 percent margin
50 / 150 = 33.3 percent
Correct
80 dollar price, 24 dollar cost = 70 percent margin
56 / 80 = 70 percent
Correct
Break even ROAS at 70 percent margin = 1.43x
1 / 0.70 = 1.4286
Correct
3,000 dollars at a 9 dollar CPM = 333,000 impressions
(3,000 / 9) x 1,000 = 333,333
Correct
1.2 percent CTR on that = ~4,000 clicks at 0.75 dollars
333,333 x 0.012 = 4,000; 3,000 / 4,000 = 0.75
Correct
2 percent conversion = 80 purchases at 37.50 dollars
4,000 x 0.02 = 80; 3,000 / 80 = 37.50
Correct
95 dollar AOV on that spend = 2.53x ROAS
(80 x 95) / 3,000 = 2.533
Correct
300 dollars a month at a 9 dollar CPM = ~33,000 impressions
(300 / 9) x 1,000 = 33,333
Correct
A CTR lift from 0.8 to 1.6 percent halves CPC
Double the clicks for the same budget
Correct
Nine numeric claims across the WinningHunter free tools, recomputed by hand. All nine hold.
That is the headline finding of this review, and it is a positive one. The WinningHunter free tools are not decorative lead magnets with decorative numbers; the arithmetic is right down to the cent, and the pages show their working so you can audit it yourself in a few minutes.
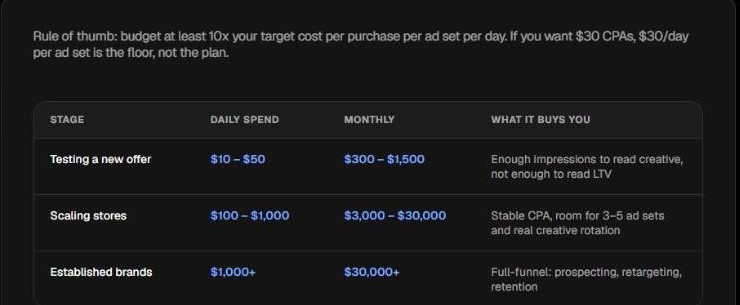
The one rule of thumb that argues with its own example
There is a single place in the WinningHunter free tools where the guidance contradicts itself, and it is easy to spot once you look for it.
The rule of thumb, and the stage table directly beneath it (screenshot from winninghunter.com).
Rule of thumb: budget at least 10x your target cost per purchase per ad set per day. If you want 30 dollar CPAs, 30 dollars a day per ad set is the floor, not the plan. — WinningHunter, Instagram Ad Cost Calculator
Ten times a 30-dollar target is 300 dollars a day, not 30. The example undercuts the rule it illustrates by a factor of ten. The table printed immediately below sides with the example, not the rule: it puts “testing a new offer” at 10 to 50 dollars a day, scaling stores at 100 to 1,000, and established brands above 1,000. Those three rows are internally consistent — every daily figure multiplied by thirty gives the monthly figure beside it exactly — so the stray sentence looks like the error, not the table. Anyone skimming the WinningHunter free tools could take away a budget floor ten times too high, or ten times too low, depending on which line they believe.
Where the benchmark numbers disagree with each other
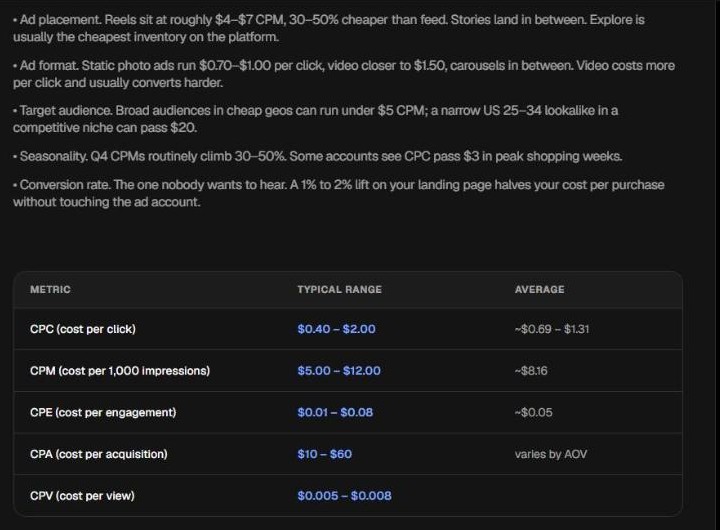
The Instagram page in the WinningHunter free tools also publishes a benchmark table, and the figures in it do not quite line up with the figures in the prose around it.
The placement advice above and the benchmark table below, on the same page (screenshot from winninghunter.com).
Metric
Typical range
Average
CPC (cost per click)
0.40 – 2.00 USD
~0.69 – 1.31 USD
CPM (cost per 1,000 impressions)
5.00 – 12.00 USD
~8.16 USD
CPE (cost per engagement)
0.01 – 0.08 USD
~0.05 USD
CPA (cost per acquisition)
10 – 60 USD
varies by AOV
CPV (cost per view)
0.005 – 0.008 USD
not given
The 2026 benchmarks as published. WinningHunter does not cite a source or a sample for these.
The table floors CPM at 5.00 dollars. Four paragraphs above it, the placement advice puts Reels at “roughly 4 to 7 dollars CPM” and feed at “8 to 12” — so inside the WinningHunter free tools the cheapest placement the page recommends sits a dollar below the cheapest CPM the same page says exists. The target-audience bullet does the same thing in the other direction, allowing broad audiences in cheap geographies “under 5 dollars CPM”. None of this is a large error in the WinningHunter free tools, and the ranges are plausible, but a reader who takes the table as gospel and the bullets as gospel ends up with two different pictures. Treat both as the company’s rough guidance rather than measured data, because no measurement is offered.
The Shopify theme detector, tested on a live store
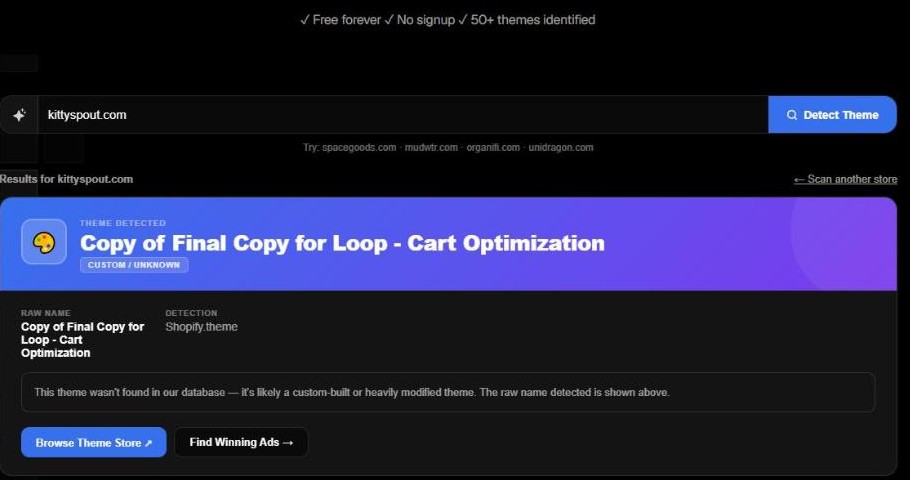
The detectors are the half of the WinningHunter free tools that do something a calculator cannot: they read a real store and tell you how it is built. The theme detector explains its own method, which is a good sign — it reads the JSON block Shopify publishes in every store’s page source, parses the window.Shopify object for the active theme, and falls back to asset URLs, CSS class signatures and JavaScript variable names when that data is not exposed. It promises a result in under three seconds and claims 50 or more themes identified.
The theme detector run against a live Shopify store, with the detection method named (screenshot from winninghunter.com).
Run against kittyspout.com this part of the WinningHunter free tools answered instantly, and answered honestly. It returned the theme name “Copy of Final Copy for Loop – Cart Optimization”, flagged it CUSTOM / UNKNOWN, named its detection source as Shopify.theme, and added a note that the theme was not in its database and is likely custom-built or heavily modified. That is the right behaviour for free tools: it reported the raw string it found instead of guessing a Theme Store name to fill the box. It also tells you something real about the store — a theme called “Copy of Final Copy for” something has been duplicated and edited more than once.
The Shopify apps detector, tested on the same store
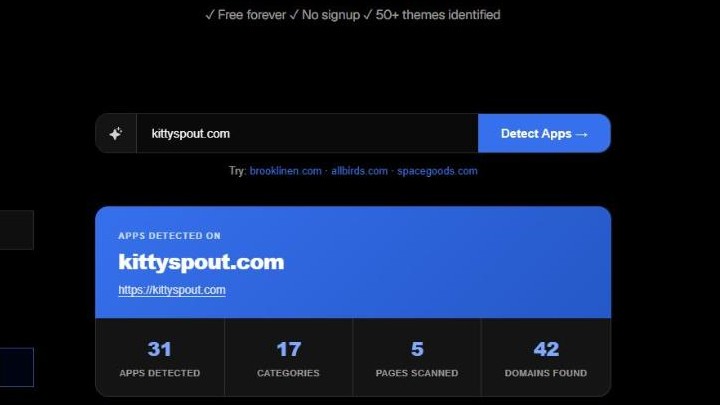
The second detector in the WinningHunter free tools works the same way on a different signal: it scans public HTML for script tags, CSS classes, API endpoints and tracking pixels, then matches those fingerprints against known apps. Because Shopify apps load JavaScript from their own domains, that is a reliable method for anything client-side.
Thirty-one apps found on one store, with the stats the tool reports (screenshot from winninghunter.com).
On the same store it reported 31 apps detected across 17 categories, from 5 pages scanned and 42 domains found, then listed them by category the way the paid dashboard does — Google Analytics and Microsoft Clarity under analytics and tracking, Judge.me under widgets, and so on down the stack. For competitor research that is the most valuable output in the WinningHunter free tools: it took one input and about five seconds, and it returned a tech stack you would otherwise have to read the page source to assemble. The honest limit is in the method itself. Anything that runs server-side, or through Shopify’s own checkout, leaves no client-side fingerprint and will not appear.
A copy-paste badge the apps page never changed
One detail on that page of the WinningHunter free tools is worth a sentence because it is the sort of thing that takes two seconds to confirm. The Shopify Apps Detector carries the badge line “Free forever / No signup / 50 or more themes identified”. Themes, on the apps page. The badge was copied across from the theme detector and never updated, and it is visible in the screenshot above. It changes nothing about what the tool does — it just tells you how recently these pages were proofread.
What the WinningHunter free tools do not do
The boundary is clear enough once you have used the WinningHunter free tools, and it is worth stating plainly so nobody expects more.
No ad data. The calculators take numbers you supply. None of the WinningHunter free tools will tell you what a competitor is spending.
No store revenue. The detectors read how a store is built, not how much it sells. Revenue estimates live inside the paid product.
No saving, no history. Nothing is stored between visits, because there is no account to store it in. Copy results out as you go. The tool pages are here.
No sources. The benchmark figures and the “2026” framing are the company’s own; no sample size, survey or data set is published.
No server-side detection. Apps and scripts that never reach the browser are invisible to the apps detector.
Where the WinningHunter free tools stop and the paid plans start
The WinningHunter free tools are a funnel, and the site is upfront about where it leads. The entry plan is 30 dollars a month billed yearly for one user, with extra seats at 20 dollars a month each; the page advertises up to 15 percent off for quarterly billing and up to 40 percent off for yearly.
Feature
Free, no account
Paid plans
Margin, ROAS and Instagram calculators
Yes
Yes
Shopify theme and apps detectors
Yes
Yes
Ad library search across Meta, TikTok and Pinterest
Limited public search
Full, included from the Standard plan
Filtering ads by spend and scaling
No
Standard and Enterprise only; Basic has a limited filter set
Store database (the site says 2 million or more stores)
No
Yes
Brand tracking, trends, TikTok Shop data
No
Yes
API and MCP access
No
Yes, on higher tiers
The free and paid boundary, from the pricing page.
Two things in that table are worth flagging for anyone budgeting. Ad search — the reason most people look at a tool like this — is described as included from the Standard plan, not the entry plan, and Basic’s filters are explicitly limited. So the step up from the WinningHunter free tools starts at the price of the door, not of the room most buyers want. The current plan comparison is on the pricing page.
Some context the tools do not give you
A calculator in the WinningHunter free tools can tell you what a 2.5x ROAS means for your margin. It cannot tell you whether the channel is worth entering at all, and the free pages do not try to. For that, independent figures help: the US Census Bureau puts second-quarter 2026 retail ecommerce sales at 340.2 billion dollars, which it reports as 17.1 percent of total retail sales. The Census Bureau publishes the quarterly series in full, revised each quarter, and it is the measured baseline that every vendor benchmark should be read against. WinningHunter sets out what its paid data adds on top. Roughly one dollar in six of American retail now moves online, which is both the reason ad costs keep climbing and the reason the arithmetic in these calculators matters.
Who the WinningHunter free tools suit
How well the WinningHunter free tools fit depends almost entirely on what you came for.
A good fit if you are pricing a product. The margin and ROAS calculators answer the two questions that decide whether a store survives its first ad campaign, and they answer them correctly.
A good fit for competitor teardowns. One URL into the apps detector returns a full client-side stack in seconds, with no account.
A good fit as a sanity check before you spend. The Instagram model is published in full, so you can rebuild it in a spreadsheet and stop using the WinningHunter free tools entirely if you prefer.
Not enough on its own for ad research. Spend data, store revenue and full ad search sit behind the paid plans, and the useful ad search starts above the entry tier.
Treat the benchmark numbers as guidance. They are unsourced, and in two places they disagree with the prose on the same page.
The short version on the WinningHunter free tools
Six WinningHunter free tools, no account, and — the part that surprised us — nine out of nine numeric claims across them check out by hand. The calculators publish their formulas instead of hiding them, the ROAS page gives conservative advice rather than promotional advice, and both detectors did real work on a real store in seconds, including admitting when a theme was not in the database. For a free tier built to sell a subscription, that is unusually straight.
The flaws in the WinningHunter free tools are editorial rather than mathematical: a budget rule of thumb that contradicts its own example by a factor of ten, a CPM floor in the benchmark table that the placement advice undercuts, a duplicated heading, and a themes badge left on the apps page. None of them will cost you money; all of them suggest the pages are shipped faster than they are proofread. And the free tier stops exactly where ad intelligence begins, which is the whole point of it.
Overall: 4.8 / 5. A set of WinningHunter free tools that does real arithmetic and real detection, let down only by copy that needed one more read.
The iPhone 18 no ports theory is suddenly everywhere. A video making the rounds on TikTok and social media appears to show something startling: an iPhone — labeled as the “iPhone 18” — charging through a small magnetic connector instead…
Hottest fashion trends 2026 reviewed honestly — which trending styles are actually wearable, which are overhyped, and what’s worth buying right now in the US market. Quick Verdict: 2026’s biggest fashion trends fall into two camps: genuinely wearable evolutions of…
PS5 Pro review 2026 — I tested it for 30 days. Here’s the honest verdict on performance, graphics, and whether upgrading from a standard PS5 is actually worth the money. Quick Verdict: The PS5 Pro is the most capable PlayStation…